

Incoming mission / Chicago
Click the envelope to open your letter.
Dear Mission Designer,
Chicago needs your eyes in space.
Map the hottest Chicago-area neighbourhoods so cooling centres open where heat is worst.
Some neighborhoods have hotter surfaces than others. We need your first useful observations within 24 hours.
— Chicago research team
Fictional educational mission request
Open the full flight brief and science sources
Mission control / priority uplink
● ACTIVE TRAINING SCENARIO
Extreme heat alert: Chicago
This training scenario replays the June 2024 heat dome that brought days of extreme heat to the Midwest.
Why space? Some neighborhoods have hotter surfaces than others. Your spacecraft must find useful observations and transmit them to the ground team.
Archived NASA imagery · not a live emergency · source & date ↗
Mission science, assumptions & data sources
What the mission models
Map the hottest neighborhoods accurately and report them within 24 hours.
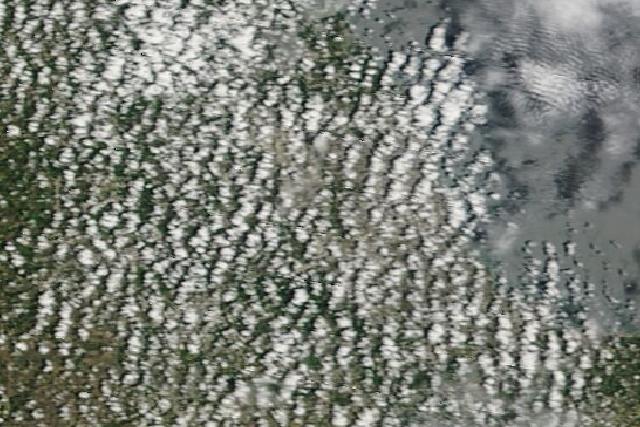
Afternoon thunderstorm clouds sometimes pop up and hide parts of the city.
Results come from the deterministic simulation. Surface temperature is different from air temperature, and radar does not directly measure surface heat.
Source provenance
- NASA MODIS Aqua 8-day and daily daytime land-surface temperature (via NASA GIBS) · NASA-observed reference · Observed: heat cells are the hottest 25% of populated cells by MODIS Aqua 8-day daytime land-surface temperature, 17-24 Jun 2024 (June 2024 Midwest heat dome; threshold 36.7 C). eventDay is the first day of 2024-06-16 to 2024-06-21 that daily Aqua LST reached the threshold (day 0 = 2024-06-16; cells hidden by cloud every day stay at day 0). Cloud blocking and sensor detectability are modelled (mostly clear skies).
- NASA SEDAC Gridded Population of the World v4, 2020 density (via NASA GIBS) · NASA-observed reference · Cells with at least 500 people per square kilometre count as populated neighbourhoods.